
We are happy to share some big changes we have pushed live for our Website Monitoring platform.
If you’re not familiar with our monitoring, it’s a cloud-based compromise detection system (CDS) for websites. It provides near real-time visibility into the security state of a website by looking for signs of compromise and changes to the website content, DNS, WHOIS, and SSL records, as well as checking blacklist reports from companies like Google, Norton and Spamhaus.
Our monitoring scanners will continuously check your site – depending on the frequency you choose – and will alert you if it detects anything suspicious. This allows you to take action quickly and reduce any negative impact on your traffic and conversions.
Note that the monitoring and backups dashboards are now fully responsive, so you can log in to your Sucuri account on mobile devices. As an added bonus, we’ve made significant performance improvements that have made our dashboard much faster.
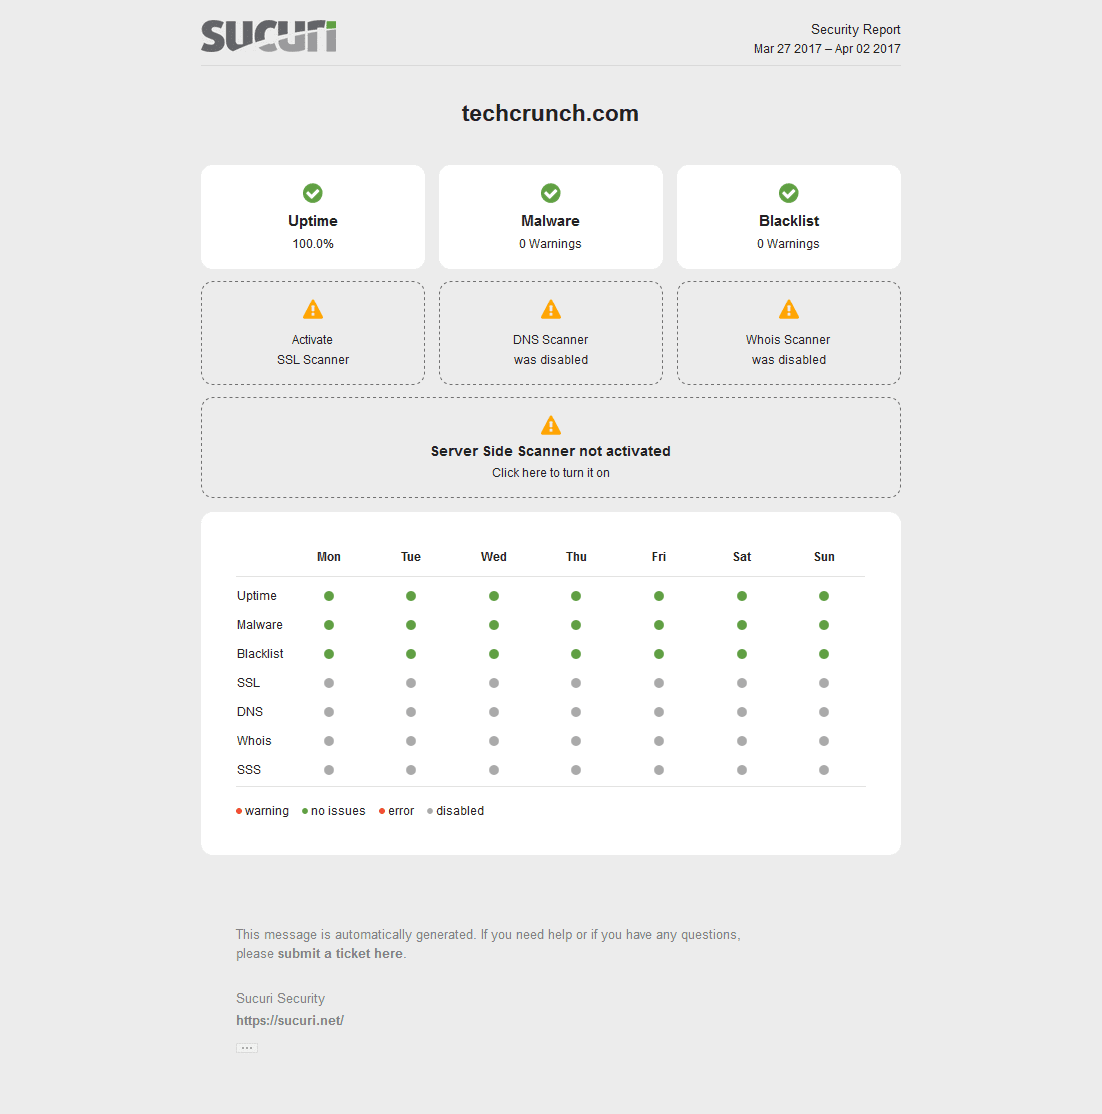
New Weekly and Monthly Reports
The new report design allows you to see an even clearer view of what is happening with your website. It highlights any issues detected on particular day (in the weekly report) or range of days (in the monthly report).
The new reports also show if any monitoring options are disabled and encourages more customers to enable these scanners and fully utilize our monitoring services.
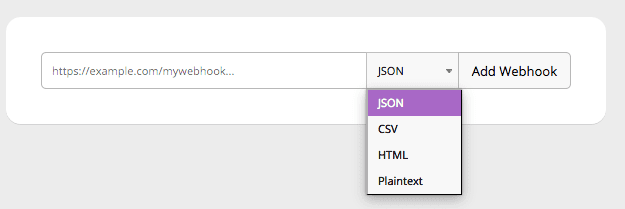
Generic Post Alerts
The older version of our dashboard included email alerts, as well as SMS and RSS notifications.
You can now receive alerts in your own systems by posting them using any the following data types:
- JSON
- CSV
- Plain Text
- HTML
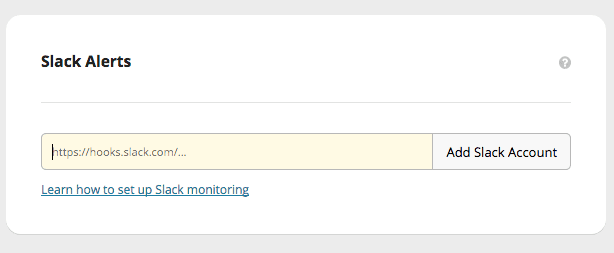
Slack Alerts
Do you use Slack? Many of our customers use the app to organize their teams and get instant notifications about important tasks.
In addition to the generic post alerts, now you can add your Slack account and receive alerts from your Sucuri dashboard.
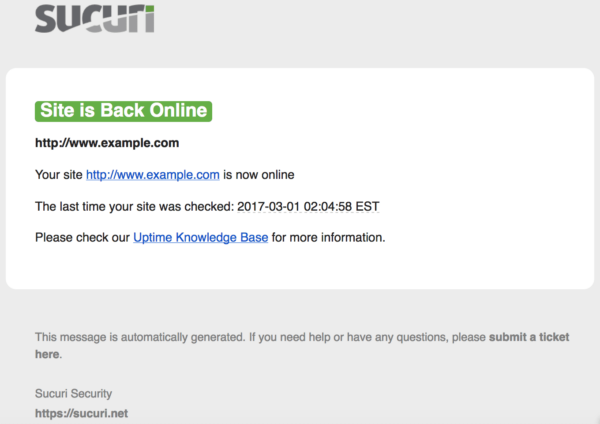
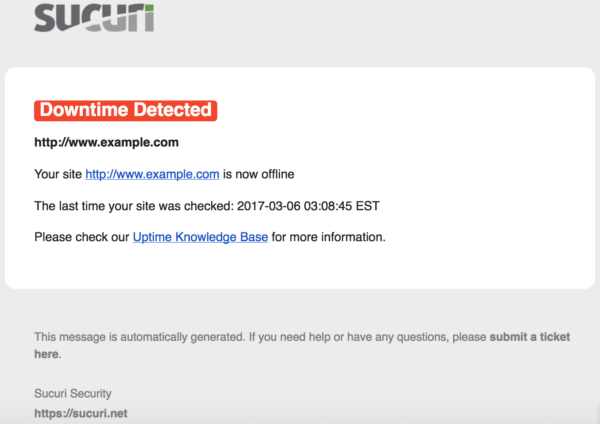
Improved Uptime Monitoring
All of our reports have undergone a new design change, making it easy to check the security status of your website at a glance.
You can now see an even clearer view of uptime vs. downtime in your dashboard, and via email alerts.
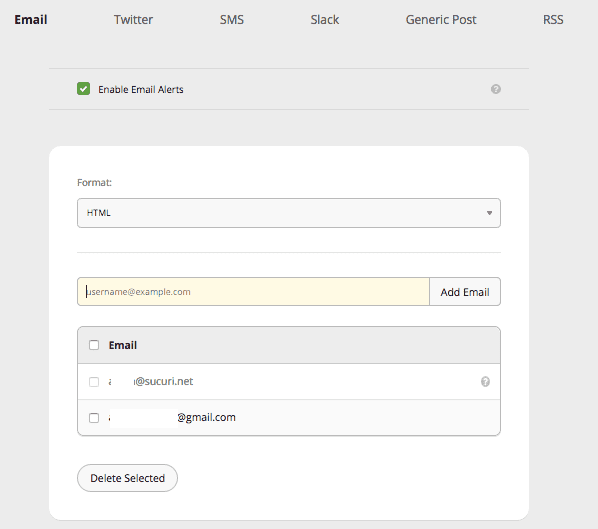
HTML Email Updates
Until now our monitoring alerts have only had plain text email as an option.
We’ve added HTML as a new email format so you can choose to receive email alerts with more clarity and nicer design.
We sincerely hope that these changes improve your experience and simplify the management of your website security. If you would like to discuss any of these updates in more depth, or have any questions, please don’t hesitate to ask.


![Malware comes in many different varieties. Analyst Krasimir Konov is on this month’s Sucuri Sit-Down to help keep them all straight. From malicious iframes to SEO spam, join host Justin Channell as he racks Krasimir’s brain on all the different types of malware. Also, Krasimir discusses his recent blog post about a malicious cURL downloader, and Justin breaks down the latest website security news, including patched plugins you should update. Podcast Transcript Justin Channell: Hello, and welcome to the Sucuri Sit Down. I'm your host, Justin Channell, and this is a monthly podcast about website security, where we get in-depth with the malware removal experts here at Sucuri. Later in the show, I'll have our analyst Krasimir Konov to chat about some different types of malware, but first, let's take a look at other topics we've published on our blog and Sucuri labs notes this month. First up, we have some new information about credit card skimming with hackers using a hybrid method to steal payment information from eCommerce websites. Our analyst Dennis Sinegubko wrote about this for the Sucuri blog back at the beginning of June. Now, most credit card stealing malware is a client side JavaScript that grabs data and sends it to a third party server. But, that approach has a drawback for bad actors because it's still possible to track the requests and catch them as being suspicious. Now, to get around that, bad actors have started harvesting information server side by modifying core PHP files. In this case, the infection would be undetectable from the outside, but it's still going to be pretty easy to find because you're rarely modifying any of those core files, so any of those changes that are going to come up are going to be suspicious. To get around both of these drawbacks, we're seeing bad actors combine the two. So client side snippets of JavaScript are sending stolen credit card data to server side scripts that they've installed on the same server as the site. Now, this allows bad actors to cover their tracks a little bit because the traffic that's being redirected is going to the same server, and that's less likely to be flagged as suspicious. It's a bit more complicated to pull this off, but our team has been seeing this hybrid approach in the wild, so it's something to be on the lookout for. Now, another month has passed, and we found more cross site scripting attacks targeting WordPress plugins. Most notably, we discovered one that affects users of the YITH WooCommerce Ajax Product Filter plugin. Now, this is a plugin that allows WooCommerce stores to be filtered by product type, and it's pretty popular. It's got about 100,000 users right now, so with it being vulnerable, it's very important that all of them update to the latest version, which is 3.11.1. Some of the other plugins we found cross site scripting vulnerabilities with included Elementor Page Builder, Careerfy, JobSearch, and Newspaper. If you're looking for a full list of vulnerabilities that have been patched this month, John Castro at the Sucuri Labs blog has you covered. Check out our show notes for the link. Also, this month I had a blog go up detailing what's called a jibberish hack. It's basically the same motivation as an SEO spam attack where bad actors use your site's good standing to redirect visitors to their own sites. But in this attack, you'll find a bunch of randomly named folders filled with a ton of HTML files with really nonsensical file names like cheap-cool-hairstyles-photos.html. It's just going to be a mishmash of keywords that clearly you didn't put there. Unfortunately, just deleting all those HTML files and folders is not going to be enough to get rid of that jibberish hack though. You're going to need to fully clean any hacked files and database tables, and then you're going to have to deal with all the damage caused to your site's standing. And just keep in mind, if you find anything about that process too daunting, we're always here to help. Now, for this month's Sit Down, we have Sucuri analyst Krasimir Konov. Earlier in June, he had written a lab's note about a malicious downloader script that used the curl function, and we chatted a bit about it, but more importantly, we went really in-depth on all the different varieties of malware that website owners need to be aware of. But, before I get started with Krasimir, I just wanted to remind you about the Sucuri Sync-Up, our sister podcast. It's a weekly website security news briefing that you can find anywhere you get your podcasts, as well as the video version on our social media feed, and now you can even get it on your Amazon Alexa smart speakers. Just search Amazon skills for Sucuri Sync-Up, add the flash briefing, and get new content delivered every Monday. Now, on with the show. Hi Krasimir, thanks for joining us on the show. I thought we could start off and maybe have you tell us a little bit about yourself and what you do here at Sucuri? Krasimir Konov: Yeah, sure. Well, I joined Sucuri originally in 2014, but I've been in the IT business for about 10 years. Nine of those I did security. And currently at Sucuri I'm one of the malware analysts. I used to work in the front lines, used to clean websites and whatnot, and then I gradually moved up, and now I'm working in the malware research department. And my day to day job is basically analyzing malware, and then once I analyze it and figure out what it is, then I will create a signature for it. And we'll add those signatures to our tools, so we can automate some of the work we do. And I also write some Labs Notes blog posts. Usually, if I find something interesting in malware or some security topic, I'll write about it. Justin Channell: Yeah. And of those topics recently that you wrote about, one was about a malicious curl downloader, and how exactly did that work? Krasimir Konov: Right, yeah. That was an interesting one, but not very unique or anything like that. We see that a lot with curl being used as a downloader. It's a very common malware. So rather than including the actual malware in the file, the attackers would use curl to download the malicious code. In this case, they'll download it from Pastebin, but it could be anything. It could be another website or anything like that, and curl would just make a call to the website, request the code. The website will respond with the code, and then later on, there is some code to either save the output somewhere on the website, or you'll just run it through eval and execute the actual code right away. Justin Channell: Right. And you said that it's commonly found in malware, but let's kind of maybe talk a bit broader about malware in general. What is everything that is classified as malware? Krasimir Konov: Well, in general it will be anything that the owner of the website didn't authorize, anything that was added by a third party. There is a lot of different malware. It could be even something like a defacement that will also be considered malware because it was something the user did not authorize. Even though it might not be doing anything malicious on the website, it's not infecting users, the visit is still something they did not authorize. So defacement would also be considered malware. And even something like ransomware where the website is technically not really damaged, it's all encrypted, but it's not infecting anybody. It's not doing anything malicious, but it's still encrypting the entire website and asking the user or the customer, the owner of the website for a ransom they need to pay in order to get the website back online. Justin Channell: Okay. Let's maybe break it down to each individual type of malware. For example, what would be a way that maybe I-frames could be maliciously used by a hacker? Krasimir Konov: Yeah. An I-frame can be used maliciously when it loads content from another location. You can look at the I-frame as a window that just opens another website. So anything that website has on it, you're pretty much loading it through the I-frame. So if that website is infected and it's serving some kind of malware, by opening an I-frame, you're loading all those elements, everything that was on this website. And sometimes the I-frame can be as small as pixel or something hidden somewhere off the screen, so you wouldn't even know that it was opening it. Justin Channell: And yeah, I feel like we've also seen a lot of them where they're used almost to mimic popups as well. Krasimir Konov: Yeah. I mean the I-frame, it could just load from another website and the other website could do anything. It could be serving just malware and it would try to infect the user that doesn't even know that they're being connected to the other website. It could just have some other JavaScript that's just trying to open up pop ups on the original website through the I-frame. Yeah, it could be a lot of things. Justin Channell: Okay. And also, let's talk a little bit about conditional redirects and how those work. What allows a script to detect which devices are coming in and where they're coming from? Krasimir Konov: Right. Yeah. That's a common one we see a lot. Basically, a conditional redirect would be something, it's a redirect on the website. It's obviously malicious, but there's certain conditions that need to be met before the redirect is actually executed or the redirect happens. For example, let's say if it's on a phishing website or a phishing page that is hidden somewhere on the website. For example, if Google visits it, obviously the attacker doesn't want Google to see the actual phishing page and record it as a phishing page. So they'll look for, for example, the IP address. They would look for the user agent. And a lot of times they can tell that it's a bot. So they'll just return a 404 response, for example, that will be like, "Oh, page not found." So Google would be like, "Oh, it looks like this page doesn't exist." But then if a regular user goes to the same page, then those conditions will be met. The actual website or the script behind the phishing will check and see, and be like, "Oh, this one is running Firefox or Chrome," and be like, okay. And then they'll look at the IP and be like, "Oh, he's in whatever, he's in United States somewhere." And he's like, "Oh, okay. That's good." And then once all of these conditions are met, then the actual script will serve them the actual phishing page. And it'll be like, "Oh, you need to fill out this to recover your account or whatever, or type in your credentials to log in here." Justin Channell: And so this is the type of thing we're really, a website owner is going to run into this more commonly when people are complaining about they're getting served bad content or whatever, and they can't seem to replicate it. It's likely probably these kind of redirects. Is that right? Krasimir Konov: Right, right. It could be something as specific as, for example, a range of IP addresses that correspond to an ISP or maybe let's say a country. It could be like, "Oh, were targeting only customers in the US," so if you're connecting from another country and you go to the same website or the same page, it would just say 404. It will give you a page not found. But then if you actually have an IP address from the United States, you're connecting from the United States, then it will actually show you the phishing page. Justin Channell: Now another type of malware I feel like we see a lot here is SEO spam. We hear people talking about that. What are some of the top SEO spam keywords that you see coming through? Krasimir Konov: Yeah. We get that a lot. We see a lot of spam on websites. A lot of times attackers will use SEO spam to gain ranking for their own website. Or they'll just try to include some kind of SEO spam in links to another website that they're currently running or something. I mean, these things change all the time. So a website might be up for a week and then it'll disappear, and then they'll start another campaign. But yeah, we see that a lot. We see all kinds of keywords they use. Most common ones will be something like Viagra. We'll have like jerseys for sale. A lot of times, they'll use name brands like Nike, Rolex, Prada. We've seen even some essay writing services for some reason. I'm not sure why, but that's common. We see, for example, pharmaceuticals a lot that will use specific medicine names. They'll use all kinds of replicas, like a replica bag of this, replica this, replica that. We'd see prescription, also payday loans. And obviously there's some adult related sites and things like that keywords. Justin Channell: So pretty much anything that people are going to be searching and clicking on are probably going to be targets for SEO spam? Krasimir Konov: Right. I think a lot of it commonly is pharma related because a lot of people are looking to buy medicine online, and a lot of times will require a prescription. So a lot of people are like, "Oh, let me see if I can find this medicine that I can buy it online somewhere." They don't need a prescription. They don't want to pay to visit a doctor and whatnot, and they'll look for it. And yeah. Justin Channell: Now, whenever somebody's website does get hacked with a SEO spam attack, what kind of effect can it have on the website beyond just being defaced? Krasimir Konov: Yeah. You can have a lot of things can happen, negative things. For example, the website can be blacklisted because of the keywords. And that usually represents a big red warning when you go on the website, depending on who blacklisted it. But if it's Google, for example, you'll see a big warning and it'll tell you this website contains malware or there's something wrong with this website. So, pretty much all the traffic on the website will be gone. And then you can also lose a lot of your reputation if there is a SEO spam on the website. For example, if you were ranked in say number five for certain keywords that represent your product on Google search engines, and then suddenly you get hit with SEO spam, then all these search engines then go and visit the website. And all of a sudden they're like, "Oh, there's all these weird key words on here, all this SEO spam that's causing a lot of mixed signals." And the search engines are like, "Oh, where do we rank this website now? Do we rank them with this product that's originally what the website is about? Or do we take into consideration all these other keywords that are mixed up that are SEO spam?" So, all of a sudden your website might go from being ranked number five on the first page to being on the 10th page. And then you rank for all these other keywords that you didn't intend to. And then people search for something completely different. They're searching for jerseys or something, or now they're searching for Prada products, and then suddenly your website pops up in there. So you're not really getting any good traffic, not targeted traffic. But, yeah. Justin Channell: Okay. So in a lot of ways, the effects of SEO spam would kind of be the same for defacements or any kind of malware with the blacklisting, but it does bring that kind of unique part to it where then it can also then bring traffic that you weren't expecting from somebody searching for jerseys, for example. I had not really ever thought about that. Krasimir Konov: Right, right. Yeah. It will definitely bring some traffic. I've seen a lot of times where websites will be connected. Let's say, there was 1,000 websites that were all infected with SEO spam, and it will kind of link each other to try to bring each other up into the rankings. And so you would see a lot of strange traffic from some random websites that were, for example, that were previously infected, even if they might not be anymore. But yeah, they'll be sending traffic to you or there'll be usually search engines sending you traffic, but for the wrong keywords. People are looking for something else, so obviously they're not going to be interested in your website. They're not going to buy anything because they're not looking for that. Justin Channell: And now, so thinking of the way websites get infected, a very common way it seems to be is through phishing campaigns. What are some recommendations you have for the best ways to avoid becoming a phishing victim? Krasimir Konov: Yeah. There is some ways. I mean, it depends really on the type of attack. Obviously, a lot of people, when they think of phishing, they think, "Oh, it's just like a PayPal phishing page and it just looks like the original," but it could be more subtle. If it's just a regular page where you're just going and you get redirected to another website, obviously the first thing to look is if you have the security padlocks, make sure that traffic is encrypted. A lot of these websites don't really have any encryption nowadays. More are starting to get that with pre SSLs being issued and whatnot. But that's the first thing to look and see, make sure. Anywhere you're typing your sensitive information, you want to make sure you have the padlock to make sure everything is encrypted. Krasimir Konov: But also you want to look at the URL of the actual website you're visiting. A lot of times they'll try to hide it. So you might have to be careful and look closely. Something that might be an I will be an L or something like that. And a capital I and L might look kind of similar into your IRL, so you might miss something like that. Say, if you're looking for PayPal and it might replace the L with an I, and if you don't look closely, it might look exactly the same. And you're like, "Oh, okay, it's paypal.com," but not really. So yeah. Just pay attention to the URL, make sure it is the actual website. There's no paypal.com dot something, dot something else, dot com. Yeah. You want it to just say paypal.com, and then it'll have forward slash and something else. But yeah, it gets more complicated when you have, for example, a phishing page that's injected into a regular page. For example, you have a checkout page on a website that you're buying things from and you go through the checkout page and you're looking at where you type in your credit card information and whatnot. And you might have a phishing page that actually looks exactly like a little box that gives you where you put in your credit card number, or your name, your address, and all that. So that will be more subtle. For example, that could be also an I-frame that's just coming from another page. And it will look exactly like it's part of the website. You're on the legitimate website, but only that portion of the website is actually the phishing page. And you look at it and you're like, "Oh, okay. It looks fine. I'm just putting my credentials." So that one could be a lot harder to figure it out. Usually, if it's something like that, I look for something that looks kind of out of place. Maybe they didn't get the right font. It might not be the same as the original website or there might be something out of place, some fields that are missing or some fields that are squished into the left or the right. It looks kind of awkward. It's like, why would this be like this? The whole website looks professional. There's a pink background or something, for example, and then suddenly there's this white box in the middle. It's like, ah, it looks kind of weird, out of place. Justin Channell: So pretty much if anything looks slightly out of place, you really should double check everything at that point. Krasimir Konov: Right. Right. Yeah. Obviously there's more ways that you can check, but I wouldn't get into more technical, like inspecting elements and looking at stuff, but yeah. Justin Channell: And now another type of malware that's kind of, and it kind of plays in with whatever the other infection is, is backdoors. Can you give us some examples of what backdoors can be? It's mainly just when a hacker can get back into the site to reinfect it, but I know there are a ton of different methods. And what are some of the more common ones and then maybe some that really interesting that you've seen? Krasimir Konov: Yeah, there is a lot. They'll probably be one of the first things the hacker would do is if they compromise a website, obviously they'll try to spread backdoors and just inject code everywhere so they can get back in, even if the owner of the website or webmaster cleans it. They want to try and hide some malicious code somewhere so they can always get back in. There's many variations. A backdoor could be something as simple as a single line of code to just [inaudible 00:20:19] argument, some kind of string or something via get or post. Krasimir Konov: And then it runs into an eval, so it evaluates the code and executes it. And some backdoors are very complex and they can be included in, let's say you have a WordPress site and you have a specific login page where all the login credentials are being processed and everything else. They could even inject code into that to basically bypass the whole login mechanism so that they can just bypass everything. They don't even have to know any user. They don't have to know the password, nothing. They'll just include some lines in there, and every time they'll be just able to log in. Yeah. It gets pretty crazy. Yeah. I mean, there's all kinds of malware. There is always a malware, for example, that just targets credit cards and will just target the eCommerce websites. And they'll just try to steal the login credentials, I mean, the credit cards. They'll try to get your address, your credit card information, any kind of CVV code or whatever you typed into the billing address, everything. And then there's also malware like the backdoors that are just trying to keep the attacker in control and trying to get them back into the website. There's just so many variations of what a malicious user might want to do on a website. Some can be something as simple as just reinfecting the website. They don't want to keep control. They just want to keep reinfecting it with some kind of malware. So even if you clean it, it would just get reinfected. Some of them in the database, otherwise might be in the files. We've seen some added into a [inaudible 00:22:14] job that just keeps running on the server. There could be malware that is just a giant to, for example, attack out of websites. Like for example, a distributed denial service where they put the same malware on thousands of websites. And then they try to send traffic to one website to try to bring it down. Yeah. People try to do all kinds of stuff with websites. We've seen even some cryptocurrency mining malware that you go onto a website and suddenly your PC starts running like crazy. And you're like, what the hell is going on? Your fans turn on and the PC is 100% CPU. And it turns out that the website has some malware that's just by mining Bitcoins with your CPU and it's using all of it. Justin Channell: Wow. Okay. So one question now, the last question I have is of all the malware that you've seen, what do you think is the coolest piece of malware that you've ever seen? Krasimir Konov: I think the coolest would be the ones that are so subtle that you don't even know that it's there. For example, we've seen some that were pretty innovative. It will be just a one liner code that's just one line. And for example, it will be let's say 40-50 characters, something like that. And that's all it is. And they'll hide it somewhere in between the legitimate code. And if you don't know what you're looking for, you would never see it. It doesn't look suspicious. There is no links to some other website. There's no some kind of encrypted code or anything like that. It's just a simple one line. And then if you're just scrolling through the file looking for something, you would never see it. It just looks like all the other code. And then if you look closely, you're like, "Oh, there's this..." Look closely, and you're like, "Oh wow, this is not supposed to be there." And then you keep looking at it and you're like, "This looks really weird." And then you see that it's actually doing some malicious things and trying to evaluate some code or taking output from the outside, I mean, some input from outside, you can call it and give it code to run. Justin Channell: Well, Krasimir, thanks for coming on and talking to us for today. Krasimir Konov: Yeah. Thank you. Thank you. I'm so happy. I'm glad I was able to do this podcast and I can't wait to do another one. Justin Channell: Yeah, we'll have you on again. Thanks. Krasimir Konov: Thank you. Justin Channell: Thanks again to Krasimir for joining us here on the Sit Down. We'll be back with another episode next month. So be sure to subscribe on Apple podcasts, Spotify, Stitcher, or any podcasting platform. Also, be sure to follow us on social media at Sucuri Security and check us out at sucuri.net. That's S-U-C-U-R-I.net. I'm Justin Channell, And this has been the Sucuri Sit Down. Stay safe out there.](https://blog.sucuri.net/wp-content/uploads/2020/05/20-sucuri-podcast-blog-post_blog_image-390x183.jpg)