A few months ago, we posted an article about the difference between IPv4 and IPv6. Our research team has expanded on those findings with additional performance tests, more domains, and more locations.
In addition to assessing the speed and performance, the analysis we are presenting today leverages statistical hypothesis tests to clearly identify winners and ties. Using a statistical test is appropriate since it is 100% based on the data; therefore impartial. It is important to note that this report considers statistical models that account for random sources of variability which are not usually directly observed through the data. This improves model estimates and provides you with more accurate results.
Though other research on this topic points out some interesting comparisons, none of the ones we investigated use a statistical model to point out a clearly defined winner.
Methodology
To perform the test, we initially ran 1,000 tests considering six different locations – four in the US and two in the UK. Each of these locations were tested with 22 domains, yielding a total of 264,000 tests.
Why so many tests? First, we wanted to gather as much data as possible in such a way that we could incorporate different patterns of traffic behavior across the day. Second, and perhaps obvious, large samples improve statistical estimates.
We selected the top sites in the world that support both IPv4 and IPv6 from multiple geographic locations to identify which one performs better. We used the curl utility to collect data for connect time and total time, as these performance metrics meaningfully represent what users notice as part of their browsing experience.
The following locations were considered in our experimental design:
- Atlanta-GA
- Dallas-TX
- New York-NY
- San Jose-CA
- London1-UK
- London2-UK
Along with the following domains:
- att.com
- bitbucket.org
- cisco.com
- cloudflare.com
- facebook.com
- google.com
- java.com
- linkedin.com
- mit.edu
- nbcolympics.com
- netflix.com
- pandora.com
- php.net
- python.org
- rackspace.com
- ssa.gov
- standford.edu
- sucuri.net
- telegram.org
- wikipedia.org
- yahoo.com
- youtube.com
On the statistical side of the methodology, our main objective is to test if IPv4 and IPv6 are statistically equal or different. Thus, we investigate the interaction between each domain over IPv4 and IPv6, for each location.
To account for different sources of variability, we employ a mixed-effects model. This means we test the significance of the effect for each interaction between IPv4 and IPv6, within each domain and each location. After the test is performed, we construct a graph with the model estimates (along with a 95% confidence interval for each estimate) representing their respective 22 domains, separated by location. This was done considering both the connect time and total time responses for each IP version.
Data Analysis
We start the data analysis by first looking at a summary of the statistics on all of the data.
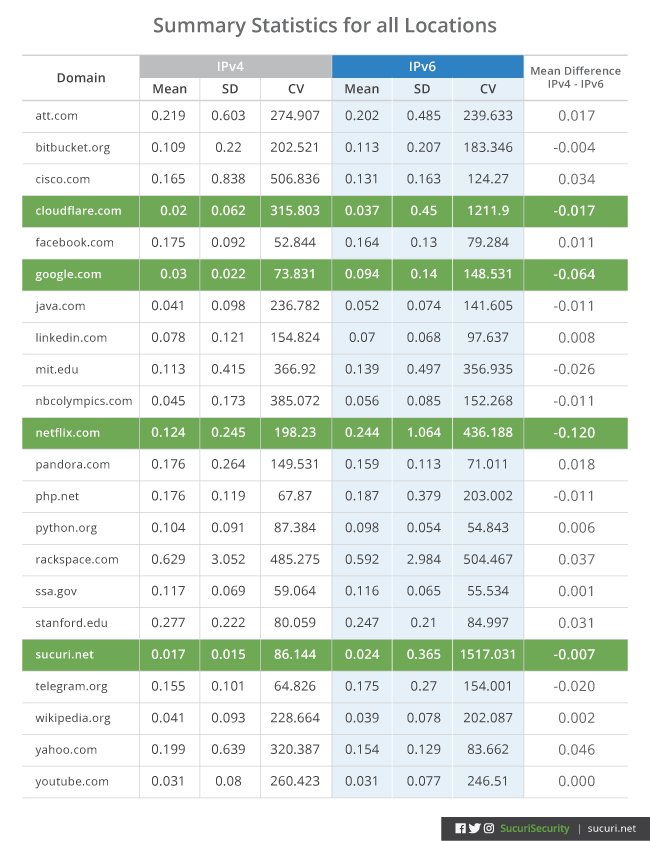
This table summarizes the statistics for each domain taking into consideration: mean, standard deviation (SD), and the coefficient of variation (CV) for each IP version.
The coefficient of variation is commonly used as a measure of risk in stock markets. In our analysis, it can be interpreted as a measure of stability for connections. The higher the coefficient of variation, the lower the stability for each IP version. The domains that presented the highest mean differences – google.com and netflix.com. Also, we call attention to two domains that presented the highest difference with regards to stability – sucuri.net and cloudflare.com. For these two domains, measures of stability are favoring IPv4 as the one with more stability in connection speed.
- The highest mean differences were observed on google.com and netflix.com
- The highest difference in stability was observed on sucuri.net and cloudflare.com, both favoring IPv4 for stability in connection speed.
Now we get into the real tests.
We have six figures that shrink a bunch of mathematical formulas and calculations in a way that we can visualize each test. In each figure, we plotted the coefficient estimates that represent the effect of the difference between IPv4 and IPv6, along with error bars representing a 95% confidence interval that will help us clearly identify which tests resulted in a tie.
Each figure contains a vertical dotted line that crosses the graph at zero. A tie is defined by error bars that intersect this line; meaning that the parameter associated with the difference between IPv4 and IPv6 is statistically close enough to be considered zero. If an error bar for a particular domain is placed away from zero and on the right side of the graph, the estimate difference favors IPv4. Similarly, if an error bar for a particular domain is placed away from zero and on the left side of the graph, the estimate difference favors IPv6.
To facilitate interpretation, we colored each error bar as follows:
- gray representing a tie
- green representing IPv4 as the winner
- orange representing IPv6 as the winner.
We hope now it will be simple to follow the next six graphs, which we will only comment on briefly.
London 1
Let’s begin analyzing the tests performed at our first of two London locations:
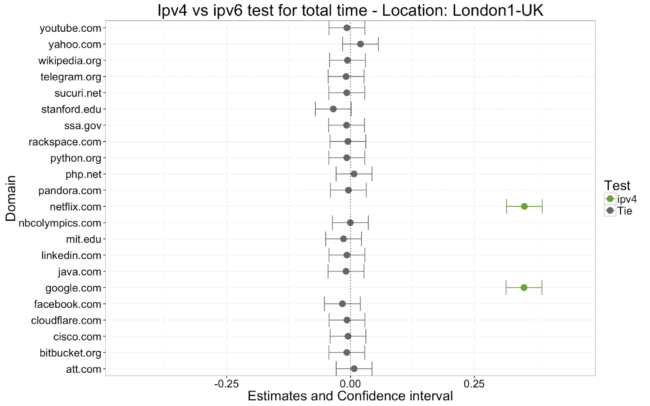
By looking at the London1 location, we can initially see that most of the error bars contain zero. Thus, we have evidence that there is no difference between IPv4 and IPv6 for those respective domains.
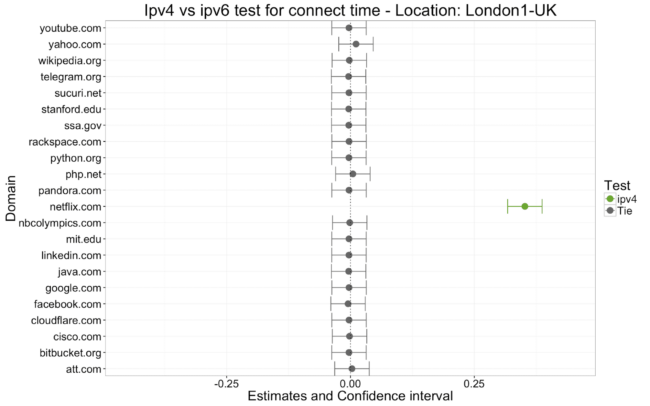
On the other hand, both google.com and netflix.com are faster over IPv4 than IPv6 for the total time. When considering connect time, we see that IPv4 is the winner only for netflix.com.
New York
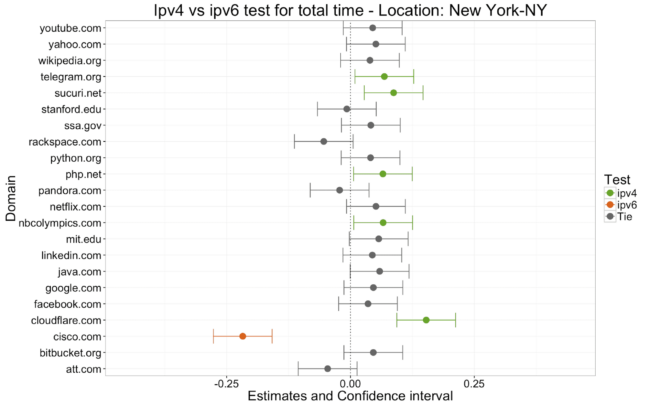
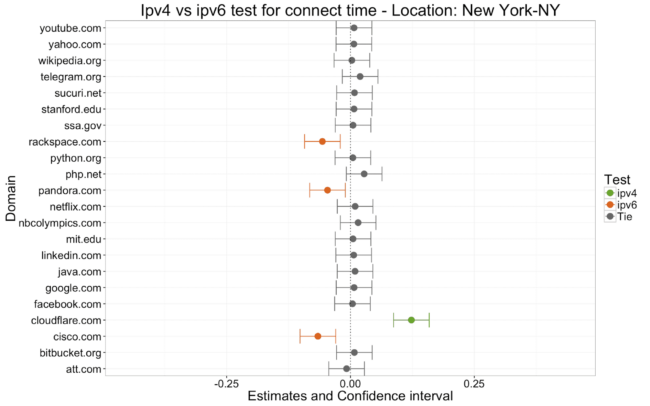
Unlike London1, New York presents more variability overall for the total time estimates. We also see that more domains present differences with regards to IPv4 and IPv6. The differences can be seen in Figure 2. The orange bars represent IPv6 as the winner for a specific domain, green bars point out IPv4 as the winner, and gray bars represent a tie.
We see telegram.org, sucuri.net, php.net, nbcolympics.org and cloudflare.com on the IPv4 side and cisco.com on the IPv4 for the total time. Connect time estimates variate less than total time. We can see rackspace.com and pandora.com on the IPv6 side actually appear for the total time as a tie, but coming towards the left side of the graph, they favor IPv6.
Dallas
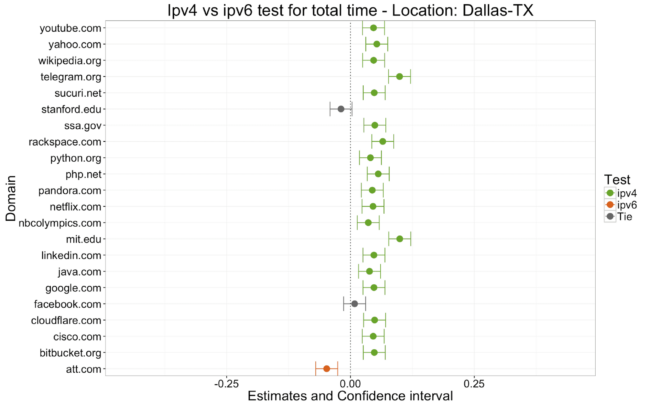
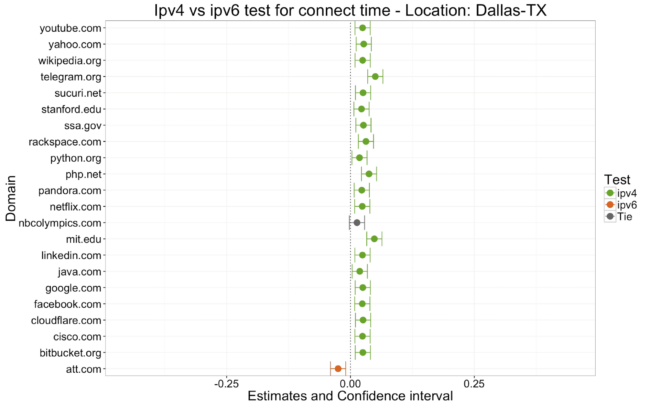
Figure 3 presents the test plot for the Dallas location. These results are quite interesting; we have a clear trend towards IPv4 as the winner for both connect time and total time. This could be due to some influence in the data center, in which IPv4 operates better and faster than IPv6.
Atlanta
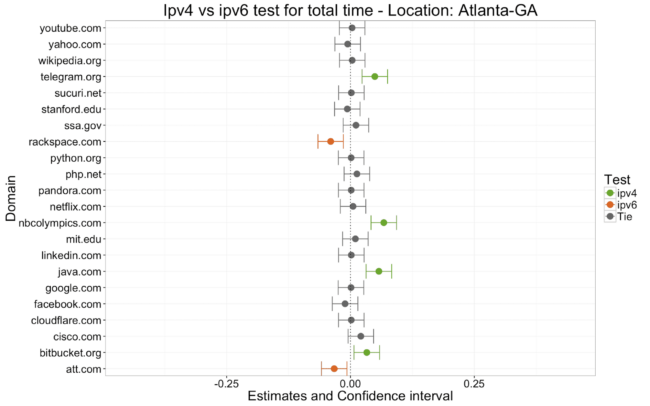
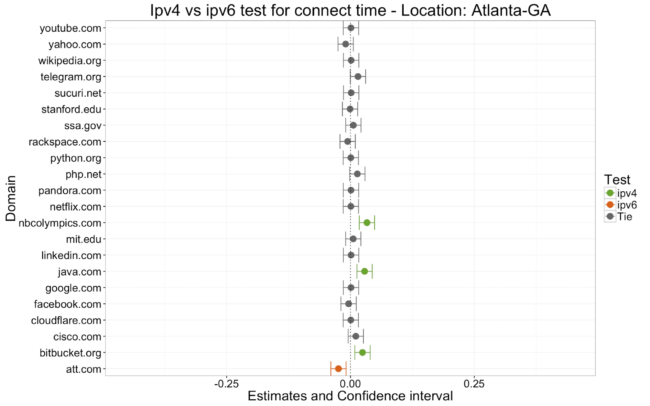
For the Atlanta location, we see that ties are more predominant than differences overall; but when there is a difference, IPv4 stands out as the one that presents more domains on its side. We have telegram.org, java.com, nbcolympics.com and bitbucket.com on IPv4’s side and rackspace.com and att.com on the IPv6’s side.
San Jose
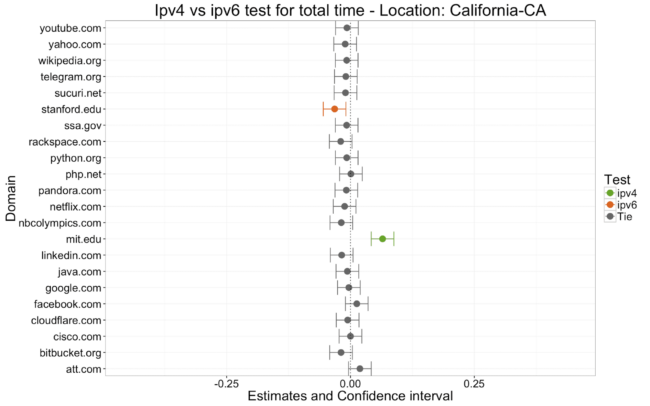
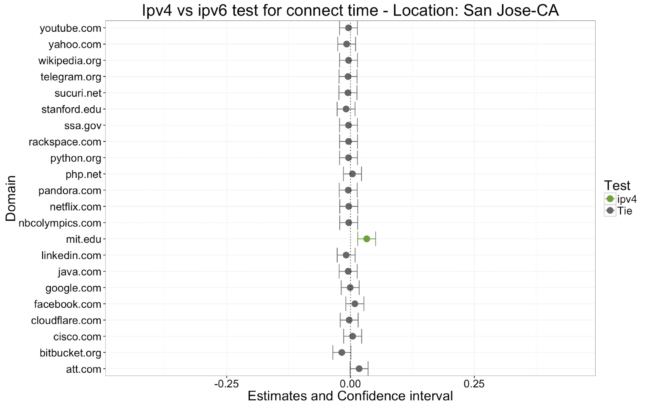
Figure 5 presents test results for the San Jose location. Here, ties are again more predominant. We have mit.edu on IPv4’s side and stanford.edu on IPv6’s side for the total time, and mit.edu for connect time. Sounds like an academic competition?
London 2
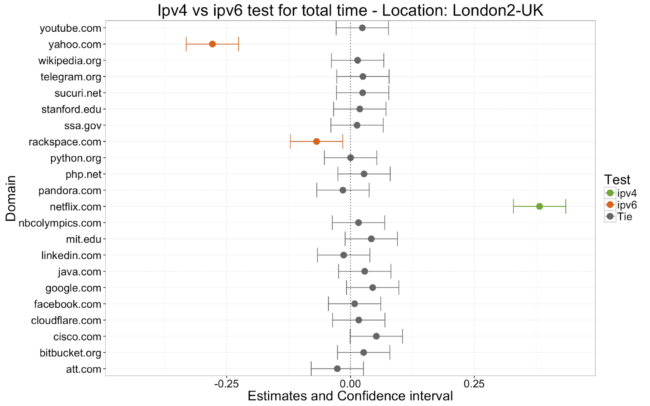
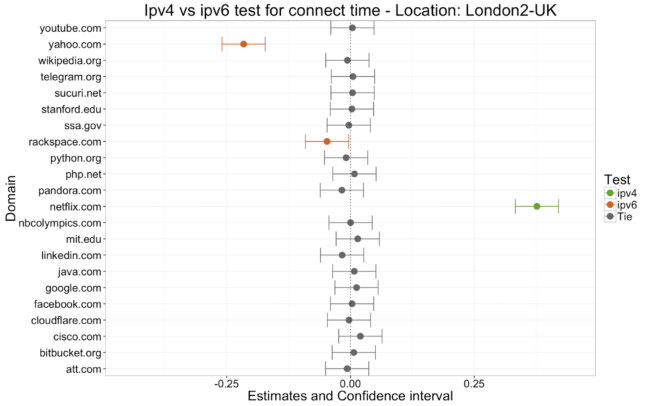
We start and end our test in London with London2. If we compare these results with the first London location we analyzed, we will notice that the behavior of both is quite similar. The main difference lies with yahoo.com and rackspace.com for going toward IPv6’s side and google.com appearing as a tie, whereas London1 is a winner on IPv4’s side. Similarities are noticed for netflix.com, which is predominantly on IPv4’s side.
Final Comments
We analyzed IPv4 and IPv6 across six different locations and 22 domains, providing a statistical hypothesis test with mixed-effects models that account for hierarchical sources of variability due to location, domain, and repeated tests. What can we take away from all of this data?
After analyzing tests for each location and domain, we can conclude that IPv4 is slightly faster than IPv6. When considering domain and location, these differences can be visualized and compared.
As the location of the data center changes, these differences might not remain consistent. That is to say, the location can affect the speed of IPv4 and IPv6. We also point out that this difference is small and represents only fractions of a second. This doesn’t mean much to a human browsing, but for machines this difference is evident.
One interesting conclusion is that IPv6 seems to be slightly less stable compared to IPv4. It generates more outliers. In other words, there is more delay in connect and total time as noted by the coefficient of variation. Perhaps the way IPv6 deals with additional headers in contrast to IPv4 may be influencing this difference. This stability is observed most evidently on sucuri.net and cloudflare.com. Interesting, as both domains deal with web security.
Looking back at our previous report, we would expect to see no difference in the performance of IPv4 and IPv6. When taking into account the mean difference of each IP version, and the variability of the process, our new test indicates some difference in the performance of IPv4 and IPv6.
Keep in mind that these locations are all based in data centers directly connected to the internet. For an ordinary home user, the connection speed may vary but conclusions are likely to be the same.
Considering the advantages of IPv6, it seems reasonable that its use will continue to grow. More machines will switch to this protocol as it offers more IP addresses with similar speed in comparison to its predecessor.


1 comment
Great Post
Comments are closed.