The Sucuri Firewall dashboard provides a rich set of API functions that can be used to control your firewall settings remotely. In addition, there is an API function to download your Audit Trails in JSON format.
The audit trail is a list of blocked requests that the firewall performed on your behalf to keep your site safe. While it’s possible to view your audit trails in your Sucuri dashboard, you can get even more powerful analysis and comparison when you load them into Splunk.
Visualizing Data with Splunk
Splunk is the defacto data logging tool in the IT world. It will enable you to view and query your Sucuri audit trails in different ways, such as graphs and activity trends over time. These types of insights can help shed light on current attacks, discover hidden trends and assist with capacity management going forward.
While the enterprise version of Splunk may be out of reach for some, a Free Splunk license exists and allows indexing of up to 500MB per day – in perpetuity. While 500MB a day is not enough for busy access logs, it’s probably more than enough to index your Sucuri audit trails.
This article covers how to get your audit trails into Free Splunk and some basic query examples.
The steps are:
- Install Splunk.
- Deploy the custom Sucuri audit trails as a source type.
- Start Splunk and (optional) downgrade to the free version.
- Get your API data from the Sucuri Firewall dashboard.
- Download your Sucuri audit trails with a script.
- Import the audit trails into Splunk.
- Query away!
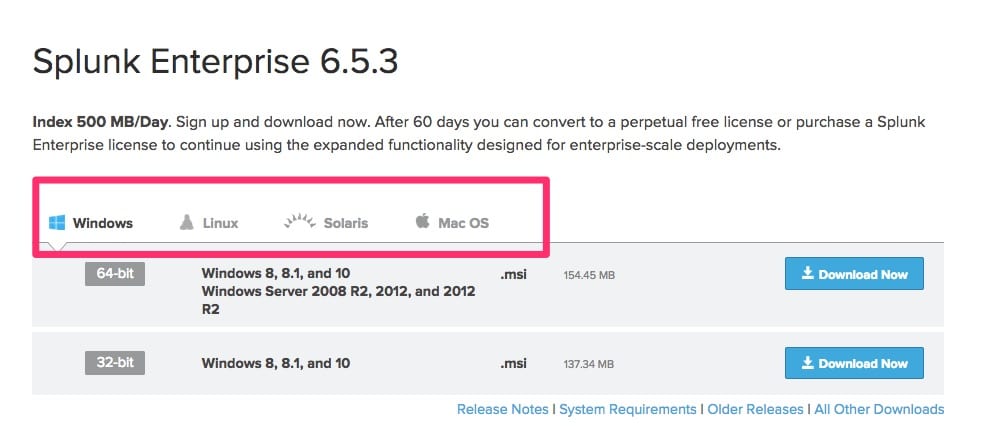
Step 1: Download and Install Splunk (500MB/day)
Note: You will need to create an account at Splunk.com.
You can download the free trial of Splunk here:
https://www.splunk.com/en_us/download/splunk-enterprise.html
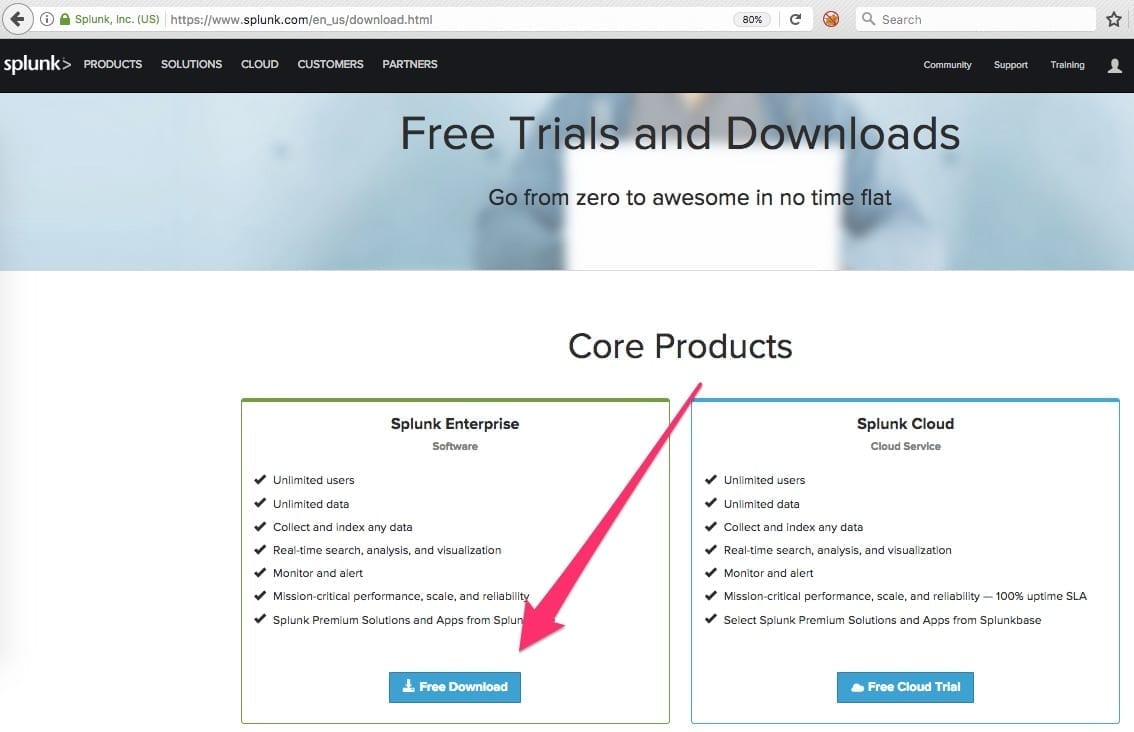
Let Splunk install, but don’t start it yet.
We want to put the custom Sucuri sourcetype in place first.
Step 2: Deploy Your Custom Sucuri Source Type
$SPLUNK_HOME is usually set as follows:
- Linux: /opt/splunk
- Mac: /Applications/Splunk
- Windows: C:\Program Files\Splunk
Copy this props.conf into $SPLUNK_HOME/etc/system/local/props.con
[sucuri_audit_trails]
 NO_BINARY_CHECK = true
 category = Structured
 description = A variant of the JSON source type for Sucuri audit trails
 disabled = false
 pulldown_type = true
 MAX_TIMESTAMP_LOOKAHEAD = 10
 TIME_FORMAT = %s
 TIME_PREFIX = "request_timestamp":
 SHOULD_LINEMERGE = true
 LINE_BREAKER = (){\"is_usable
If there is an existing props.conf, you probably want to just add this sourcetype to it rather than replacing the file.
Step 3: Start Splunk and Verify Source Type
Start Splunk now. You can do this from the command line:
$SPLUNK_HOME/bin/splunk start
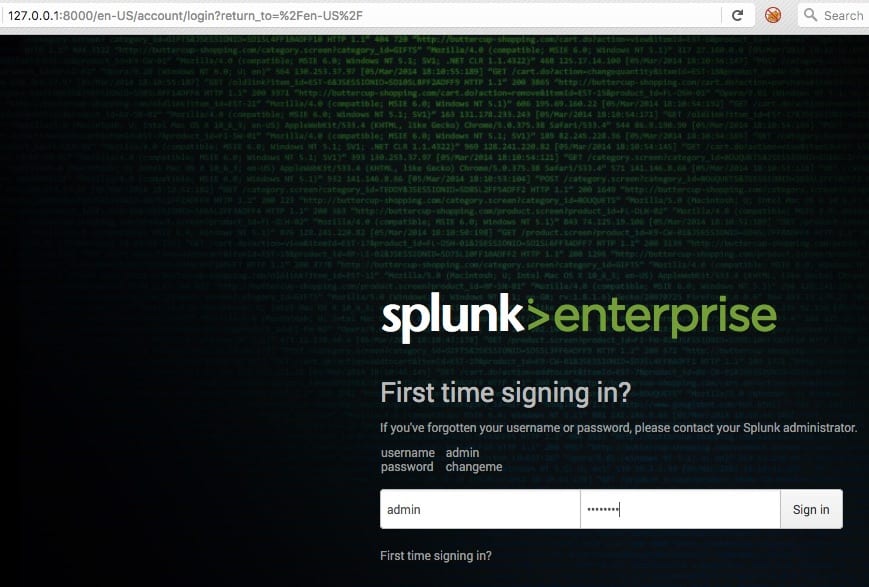
You will need to log in for the first time using http://127.0.0.1:8000 and the username admin and the password changeme.
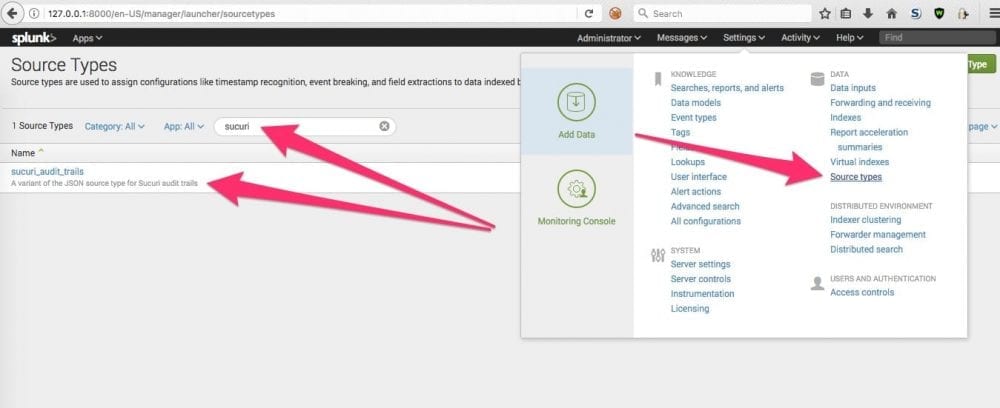
Quickly check the source types list to ensure the new Sucuri audit trails source type shows up in the list.
Go to Settings > Source types and then search for sucuri.
You don’t need to do anything – just ensure it shows up in the list prior to importing any audit trails.
Downgrade Splunk Version (Optional)
The Splunk version you download is the full Enterprise version trial. It will expire at some point and you will be downgraded to Free Splunk. You can feel free to use the Enterprise trial until it downgrades – but I prefer to downgrade immediately. This ensures that I do not inadvertently use some Enterprise function that I come to rely on and lose it when the license is downgraded to Free Splunk. You can check out the differences between Splunk versions to learn more.
If you want to downgrade your Splunk right away, use the following steps:
- Settings > Licensing > Change Licensing button
- Select Free License
- Restart Splunk
Step 4: Download Your Sucuri Audit Trails
Follow these basic steps to import your Sucuri audit trails into Splunk.
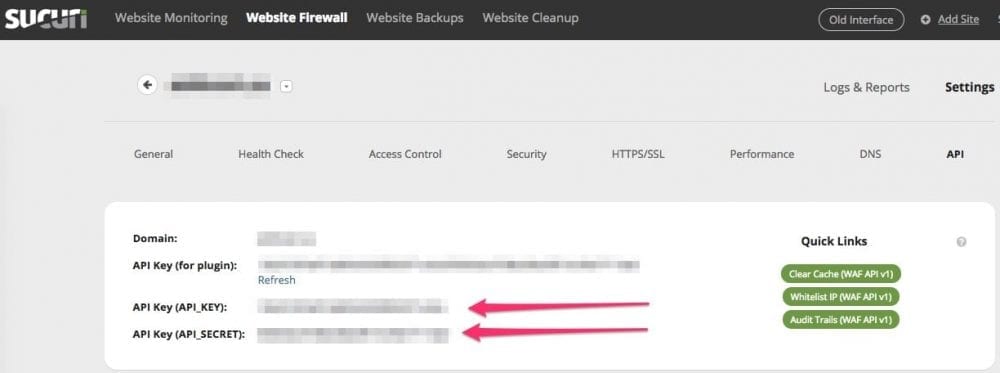
First, log in to your Sucuri Dashboard and navigate to Website Firewall > Gear icon > API.
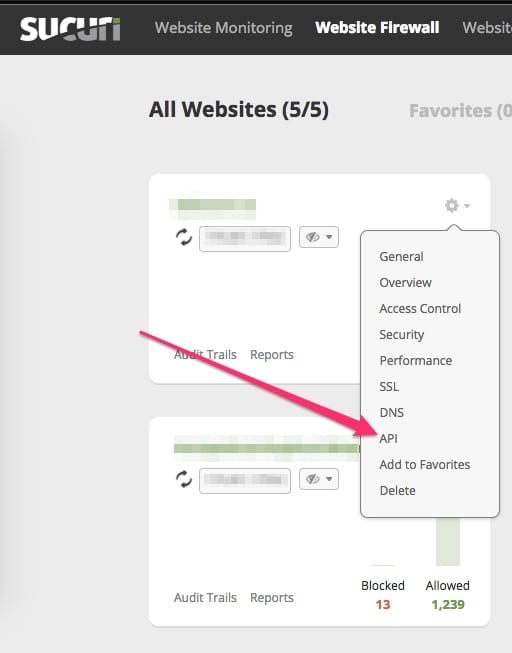
Copy your site’s API key and API secret.
You can now construct a script to grab your audit trails and inject them into Splunk.
Step 5: Creating the Audit Trails Download Script
The following commands are a sample Linux script that works on Linux and MacOS. There may be similar Powershell or batch commands you can use in Windows. This can be made more elegant – have fun with it!
This script will pull down the audit logs for the date specified as argument 1, and store it in a file specified by argument 2.
Note: I have chosen to download audit trails for my sokd site, so I used that name in these examples. Anywhere you see sokd, you can replace that with something more meaningful for your server.
curl "https://waf.sucuri.net/api?v2&k=$API_KEY&s=$API_SECRET&a=audit_trails&date=${1}" >> $2I named this script sokd.api-call – you can call it in a loop for each date you are interested in. I did this on the 14th of April 2017 so my seq call is for days 1-13.
for date in `seq -w 1 13`;do ./sokd.api-call 2017-04-$date sokd; done`
A note about audit trail limits: You will only be able to pull down 1000 lines of your audit trails using this method. If you have a particularly busy site, you will need to make use of several other parameters in your API call. This advanced issue will be covered in a later post, but the basic building blocks you will need are as follows.
The first record returned has a total_lines element.
This contains the total number of audit trail lines that were requested (in this case, 1534):
{"status":1,"action":"audit_trails","messages":[],"request_time":1492611998,
"output":{"total_lines":1534,"access_logs":[{"is_usable":0}
You can use that value, along with the limit and offset arguments, in the API call to iterate through as many API call loops as required to retrieve all of your audit logs. There is more information on those parameters on the API tab of your Sucuri Firewall dashboard.
Step 6: Import Your Audit Trails into Splunk
You can now add the data to Splunk using the oneshot command.
Note: You only need the -auth parameters if you’re not running in Free License mode (the Free mode does not have users).
$SPLUNK_HOME/bin/splunk add oneshot sokd -rename-source sokd -sourcetype sucuri_audit_trails -auth admin:changeme
It can take a few minutes for the data to be indexed so if you do not see it in your query results right away, don’t panic. You can query your new sourcetype to see what events are now in it.

Note that the oneshot command does not check for duplicates. You will want to ensure that the audit trails you’re importing do not already exist in Splunk. If you end up with duplicate data, there are ways to remove duplicate data depending on your situation.
How to Query Splunk Data
Splunk is a very deep topic, and learning how to query data in Splunk can become complex. However, it is easy to get started with some basic knowledge.
Each log line is an event – all events in Splunk belong to a source, a sourcetype and an index. Using those three things, you can usually find anything you like. Splunk will even try to help you by auto-filling your query for you with some guesses of what you want.
Example Queries with Splunk
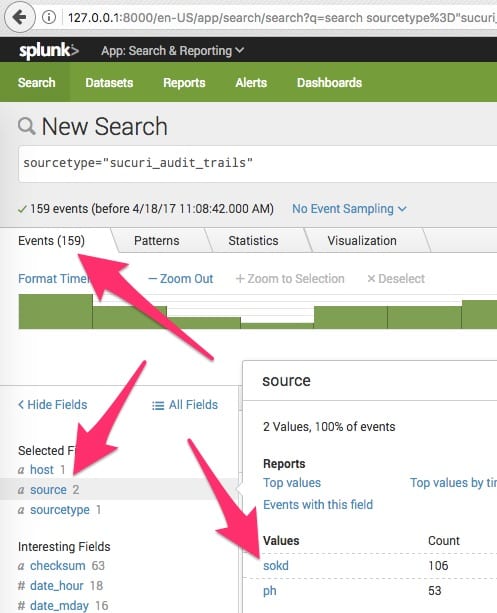
Note that I have two systems loaded into Splunk: sokd and ph. Each is a ‘source’ in Splunk parlance.
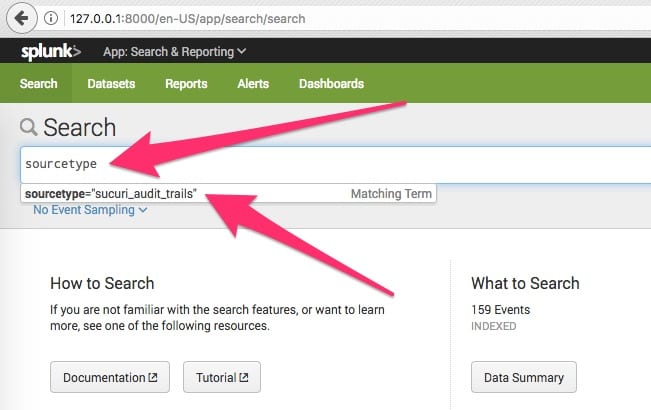
To find all events across all systems:
- Query purpose: Show all events from your audit trails
- Query syntax: sourcetype=”sucuri_audit_trails”
When doing this, note that I have 159 total events.
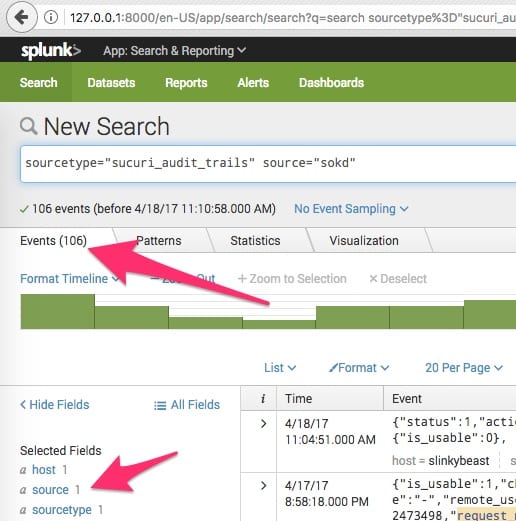
I can further limit my search to only sokd by adding ‘source=sokd’.
- Query purpose: Show all events belonging to the site ‘sokd’
- Query syntax: sourcetype=”sucuri_audit_trails” source=”sokd”
Note how my matching events go from 159 to 106 because the ph events are no longer in the results:
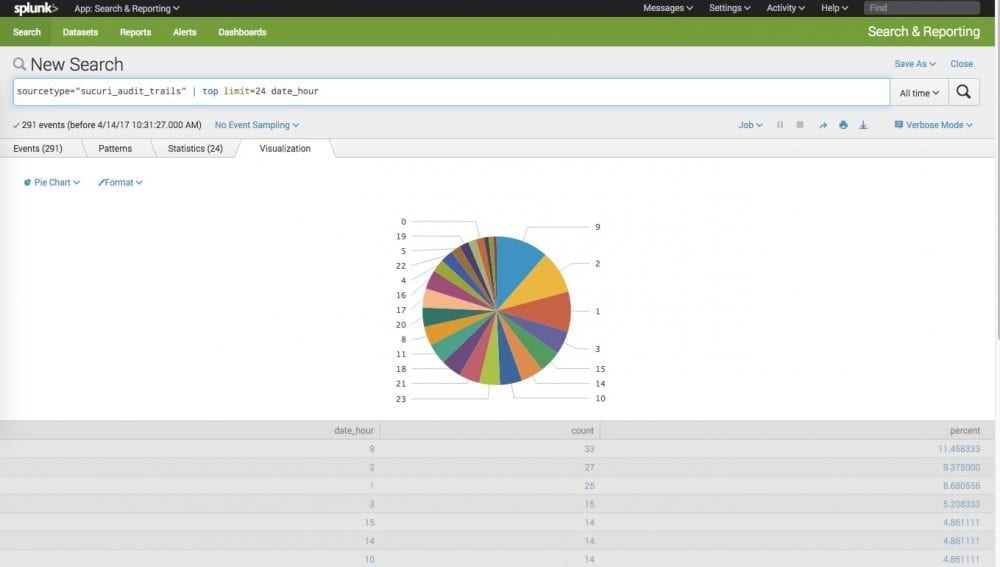
Using the Visualization Tab
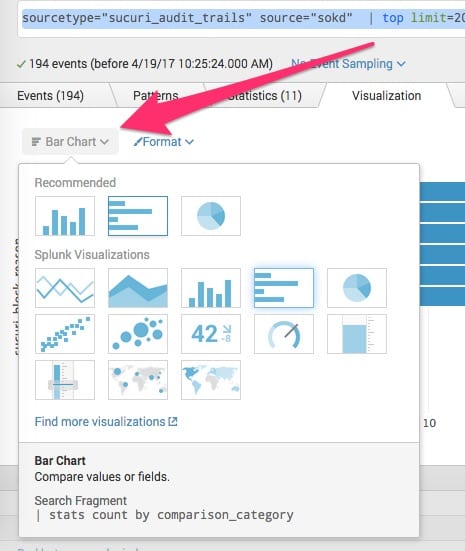
To get some basic graphs, you can click the Visualization tab after your query has run.
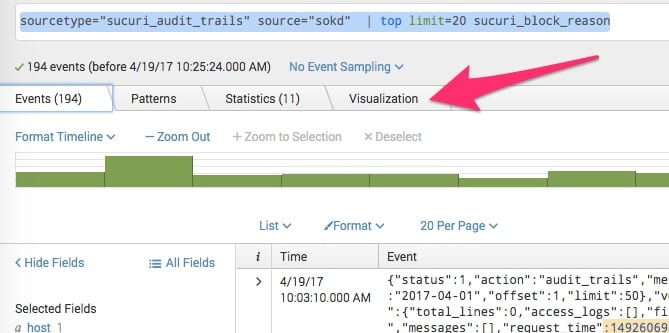
From there, you can select the type of graph you’d like.
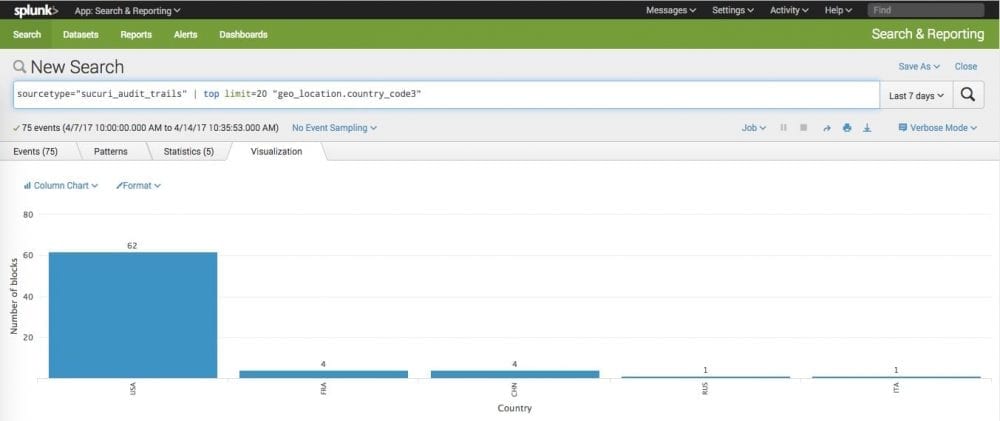
Example Visualizations with Splunk
Here are a few sample queries using the Visualization tools.
- Query purpose: Determine the top attacking IPs over time from all sites
- Query syntax: sourcetype=”sucuri_audit_trails” | timechart count by remote_addr limit=30
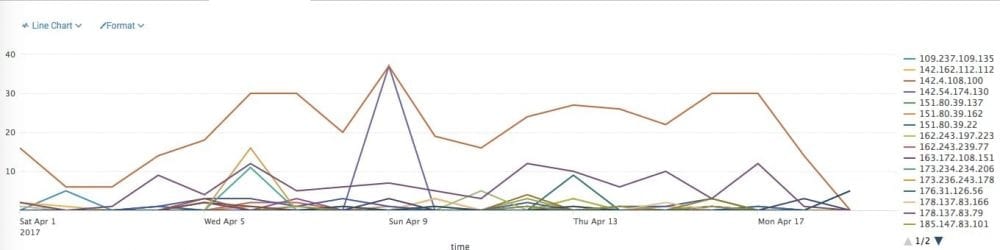
We can easily see that over time, 109.237.109.135 is blocked the most, but it never spikes. The big spikes are from 45.33.76.17 and 142.54.174.130. This is interesting trend data which is not readily available from looking at individual daily audit trails.
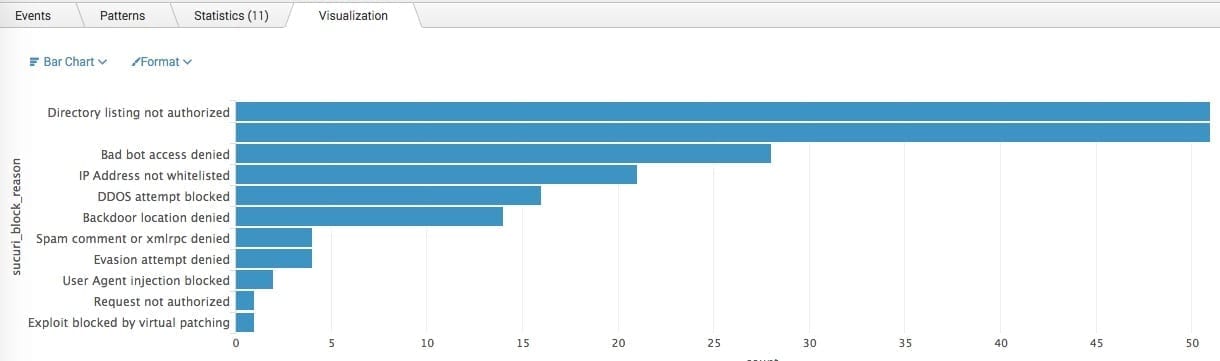
- Query purpose: Determine top firewall block reasons over time from one site
- Query syntax: sourcetype=”sucuri_audit_trails” source=”sokd” | top limit=20 sucuri_block_reason
A note on indexes: Splunk indexes help establish different retention periods and different user permissions for specific data. I have not specified an index in my examples which means my data is all stored in Splunk’s default index. Since Free Splunk has no concept of user permissions and I don’t want different retention levels for my various site’s audit trails, there’s no advantage in using a custom index for my use case. Arguably, if my audit trails were to grow to massive proportions over time, then perhaps putting them in separate indices would help with query speed but I don’t think that is likely given the relatively small dataset of the audit tails.
Once you have a handle on the basic query syntax, you can then delve into Splunk’s rich graphical representation abilities to make charts and dashboards.
It’s important to know what’s going on with your website. If you use the Sucuri Firewall, our dashboards offer reporting so that you can see how effective it is at blocking threats. For data junkies who are comfortable with the command line, Splunk offers a playground of information for you to explore.